How-to · Data ops · Oct 2026
Stack map for data ops (Oct 2026): inventory AI seats by analytics and BI job
Data teams accumulate AI features fast: a BI copilot, a notebook agent, a warehouse assistant, a dbt allowance, spreadsheet AI, and chat seats on top. This how-to gives you one blank table to see which tool owns which job and where two tools overlap. It has no vendor prices of its own — you fill costs from invoices.
What this page covers
This page is for the data lead, ops lead, or finance partner who suspects the company pays for several AI tools that answer the same data questions. It’s a method, not a ranking: build the table, fill what you know, and let the overlaps show you where to look.
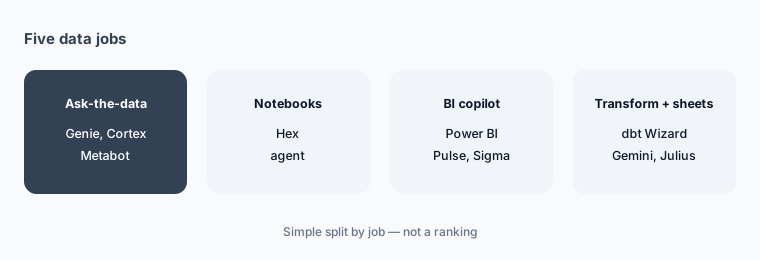
Five jobs cover most data-ops AI spend: ask-the-data (plain-English questions on governed data), notebooks (analysis in SQL and Python with an agent), BI copilot (AI inside dashboards and reports), transformation (AI that edits models, tests, and docs), and spreadsheet AI (AI inside Sheets or Excel, or chat on a file).
Major features (with how someone uses them)
Examples at a glance: each feature has a concrete example from a real job plus a short Try this you can run this week.
1. The blank table (primary)
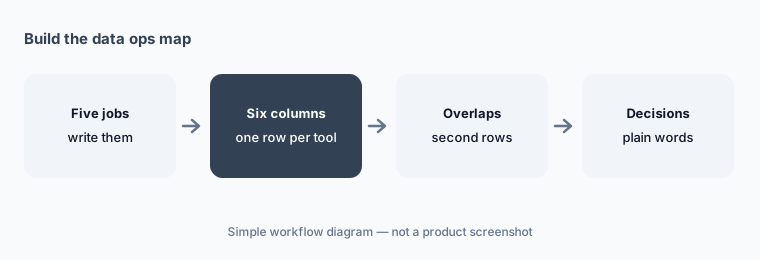
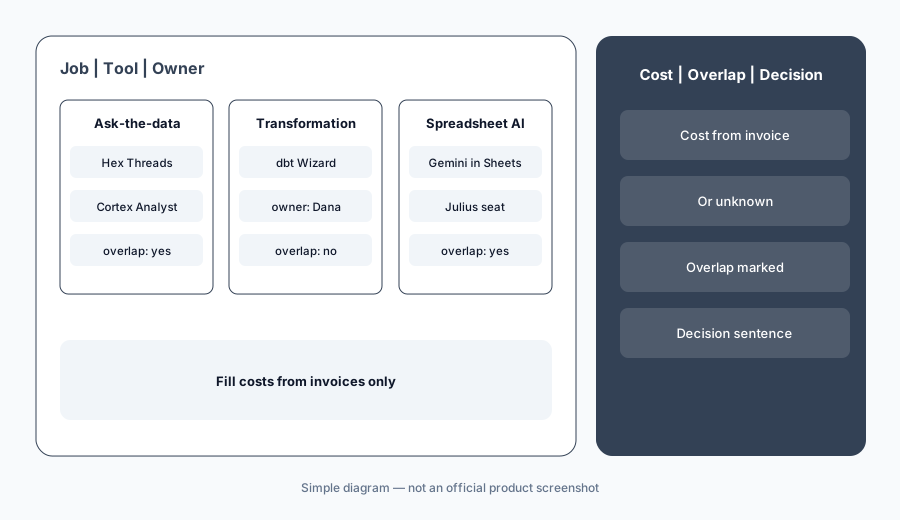
What it is: Six columns: Job, Tool, Owner, Cost/mo, Overlap, Decision. One row per tool per job. If two tools touch the same job, that job gets two rows — and the second row is your overlap. Decision is a plain sentence (“keep Threads for stakeholders; stop the separate ask-the-data pilot”), not a score.
Primary workflow:
Build Job | Tool | Owner | Cost/mo | Overlap | Decision blank for: ask-the-data, notebooks, BI copilot, transformation, spreadsheet AI.
2. What each job means so the rows don’t blur
What it is: Ask-the-data: a business user asks in plain English and gets an answer from governed tables (Databricks Genie, Snowflake Cortex, ThoughtSpot Spotter, Metabase Metabot). Notebooks: analysts work in SQL or Python with an agent (Hex). BI copilot: AI inside reports and dashboards (Power BI Copilot, Tableau Pulse, Sigma). Transformation: AI that edits models, tests, and docs (dbt Wizard). Spreadsheet AI: AI in a sheet or on a file (Gemini in Sheets, Julius). General chat seats used for SQL review (Claude for data ops) can go in a sixth row if they’re a real part of the work.
Define before filling:
Paste the five job definitions above the table. When a tool fits two jobs, give it two rows and a one-line note on who uses it for which.
3. Cost from invoices, not from memory
What it is: Fill Cost/mo only from an invoice or billing page. Many data AI features are usage-based (Wizard tokens, Genie and Cortex credits, Hex and Julius credits) or bundled into capacity (Power BI Copilot on Fabric), so the honest cell is often “usage — see bill” or “unknown.” Unknown is a valid answer until finance looks.
Invoices only:
For every row, write the cost from the last invoice or billing page, or “unknown.” Don’t copy a list price from a website into this column.
4. Which review explains each tool
What it is: Once the overlaps are visible, the reviews linked above explain what each tool does well. For the most common overlaps, start with Hex vs Julius AI (notebook vs file chat), Genie vs Cortex Analyst (two warehouses), and Power BI Copilot vs Tableau Pulse (two BI platforms).
One comparison:
Pick the job with the most rows. Read the one comparison page that covers it, then write the Decision cell in one sentence.
Pricing context (October 2026)
This how-to has no vendor prices of its own. Put only costs you can see on an invoice or billing page into Cost/mo. The individual reviews linked above list each vendor’s published prices as checked in October 2026, or say when a vendor doesn’t publish them. The $9 toolkit spreadsheet and $19 audit are optional next steps if the map shows overlap; they aren’t needed to fill the table.
Uncertainty: Usage-based AI costs don’t appear on marketing pages and change month to month. “Unknown” is the right cell until someone checks the bill. We didn’t pre-fill any vendor prices.
When it’s useful (honest take)
Useful when the data team, ops, and finance each bought AI features and nobody can say which job each one owns.
Less useful as a shopping list. If every job has one tool and no overlap, you don’t need another seat.
Comparing several AI tools for the same job? The $9 AI toolkit spreadsheet puts each one you pay for on one page with cost, usage, and payback, so overlaps are easy to spot.
Want someone to do it for you? AI toolkit audit — $19
Related options (educational)
| Need | Better home | Why |
|---|---|---|
| The inventory itself | This blank table | Five jobs, six columns |
| Notebook vs chat on a file | Hex vs Julius AI | Most common ask-the-data overlap |
| Two warehouse assistants | Genie vs Cortex Analyst | If you run both platforms |
| Two BI platforms | Power BI Copilot vs Tableau Pulse | Ask-the-report vs digests |
| Transformation AI | dbt Wizard | Tests, docs, refactors |
FAQ
Is this a ranking of data AI tools?
No. It’s an inventory method: one row per tool per job, so overlaps become visible. The decision is yours.
What if I don’t know what a tool costs?
Write “unknown” or “usage — see bill.” Many data AI features are usage-based or bundled into capacity, so invoices are the only reliable source.
Why five jobs?
Ask-the-data, notebooks, BI copilot, transformation, and spreadsheet AI cover most data-ops AI spend. Add a row for general chat seats if they’re a real part of the work.
Do I need the paid spreadsheet?
No. The blank table on this page is enough. The $9 spreadsheet and $19 audit are optional if you want more structure or a written review.
Optional next step (if seats overlap)
If the map shows two or three tools on the same data job, the toolkit spreadsheet or the audit can help you write the decision down. Map the overlap with the $19 AI toolkit audit or the $9 AI toolkit spreadsheet.
Both pages explain what you get and how delivery works before you decide.