Tool · Data & BI · Julius · Oct 2026
Julius AI review (Oct 2026): chat-based analysis of spreadsheets and CSVs
Julius is a chat workspace where you upload a file (or connect a database), ask questions in plain English, and get tables and charts produced by code it runs in a cloud container. It’s handy for one-off spreadsheet analysis without a warehouse. It’s the wrong home for governed company metrics. This page shows the jobs it does well, a Try this for each, and where a person still checks every chart.
What this Julius AI page covers
This page is for the ops manager, marketer, or finance generalist who has a CSV export and a question — “which regions drove the drop?”, “chart weekly sign-ups” — and no data team on call. It answers what Julius can do with that file, what it costs, and how to check its work before a chart lands in a deck.
Julius has grown beyond data analysis. Its October 2026 site describes an “AI workspace” for research, analysis, presentations, websites, images, and video, all running on one credit balance. We focus on the analysis side: files, the Data Explorer, data connectors, and scheduled runs. One change worth knowing: Julius’s docs say Custom Agents have been sunset, with custom instructions and reusable skill files recommended instead — though parts of its pricing page still mention them.
Facts here come from julius.ai/pricing and the Julius docs (files, containers, credits, data connectors, Data Explorer, privacy and security), read on 5 October 2026. Where Julius’s own pages disagree, we say so.

Major features (with how someone uses them)
Examples at a glance: each feature has a concrete example from a real job plus a short Try this you can run this week.
1. Upload a CSV, ask for charts, recompute one total (primary)
What it is: Julius accepts CSV, Excel, JSON, Parquet, SQLite, SPSS, and more, plus linked Google Sheets. You ask in plain English; Julius writes and runs code (its docs mention Python libraries such as matplotlib, seaborn, and plotly) in a container — a cloud environment that spins down after an hour of inactivity — and returns tables and charts you can export.
Because the analysis is code, the useful habit is to recompute one number yourself. Charts can be right about the shape and wrong about the total if a filter, a duplicate row, or a date parse went sideways.
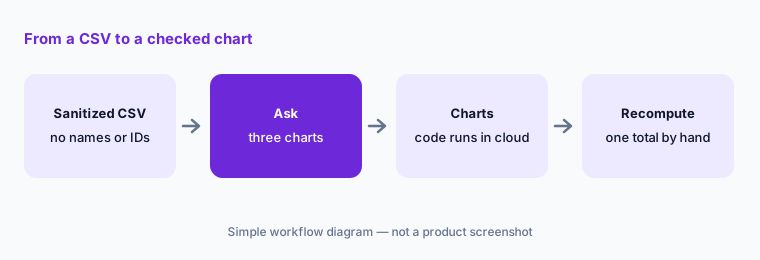
Primary workflow:
Upload a sanitized CSV. Ask for three charts. Recompute one total by hand in a spreadsheet and compare it to the chart before you share anything.
2. Data Explorer: look at the dataframe behind the chart
What it is: Julius’s Data Explorer shows the dataframes it created during the conversation in a table you can page through (49 rows at a time), filter by asking Julius, and export as CSV. It’s the quickest way to see what the chart was actually built from — which columns survived cleaning, which rows were dropped.
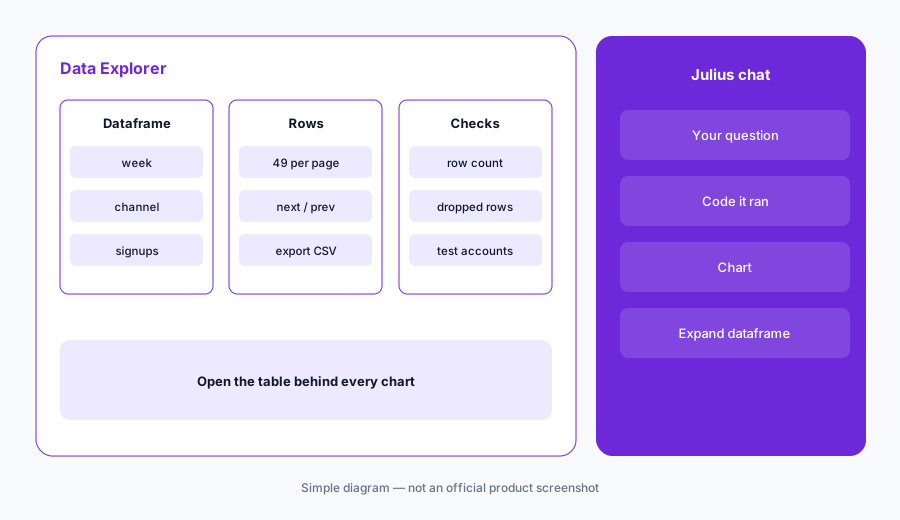
Open the data:
After Julius makes a chart, open the dataframe in Data Explorer. Count the rows and compare them to your original file. Ask Julius to explain any rows that went missing.
3. Data connectors: when the file becomes a database
What it is: Julius can connect to PostgreSQL, MySQL, SQL Server, Snowflake, BigQuery, Databricks, Supabase, and Vertica, plus Google Ads and Meta Ads, and writes and runs SQL from your questions. Its docs describe filtered schemas to limit which tables and columns it sees and a learning sub-agent that builds up knowledge of your schema. Julius also offers a Slack agent that can use your connectors.
This is where the “wrong home for governed metrics” caveat bites. Julius learns your schema, but it doesn’t carry your company’s certified metric definitions the way a semantic layer or BI tool does. Use read-only credentials and a filtered schema if you connect at all.
Keep it read-only:
If you connect a database, use read-only credentials and a filtered schema with only the tables you need. Ask one question your dashboard already answers and note any difference before trusting new ones.
4. Credits, models, and reasoning levels
What it is: Julius measures usage in credits, not messages. Its docs say cost depends on the action (a simple message costs less than running code), the model (frontier models use more), and complexity. Paid plans renew credits each billing cycle; unused credits don’t roll over, and Julius says top-ups aren’t supported — you upgrade instead. A Reasoning toggle makes Julius plan and check multi-step tasks, and higher reasoning levels (paid plans) spend more credits.
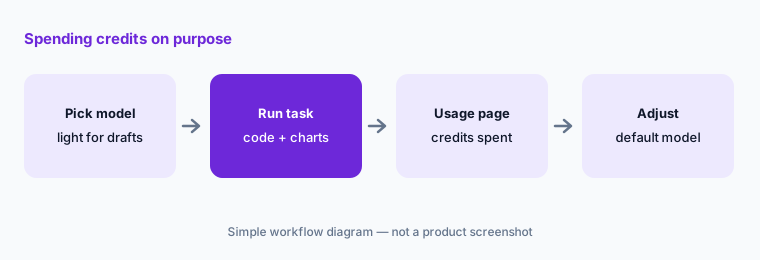
Watch the meter:
Run the same small analysis once with a light model and once with a frontier model. Check the Usage page after each, and decide which model is your default.
5. Where files live and how long they stay
What it is: Julius’s files doc says free-tier files are deleted after 1 hour of inactivity and paid users’ files stay up to 7 days of inactivity; you can delete files any time. (Its pricing table separately advertises “permanent file storage” on paid plans — another reason to check before relying on Julius as storage.) Its privacy FAQ says data is stored and processed in the United States, that Julius doesn’t train models on your data, and that AI providers are contractually bound not to. Julius says it is SOC 2 Type II compliant.
Sanitize first:
Before uploading, delete names, emails, and IDs you don’t need for the question. After exporting results, delete the file from My Files yourself.
6. Versus Hex, Sheets with Gemini, and Claude
What it is: Julius fits a one-off file and a person who wants charts fast. Hex fits teams whose data already lives in a warehouse and who need shared, endorsed answers — see Hex vs Julius AI. Google Sheets with Gemini is enough when the data is already in a Sheet. Claude can analyze a pasted table or uploaded file in a Project, which may already be on your invoice.
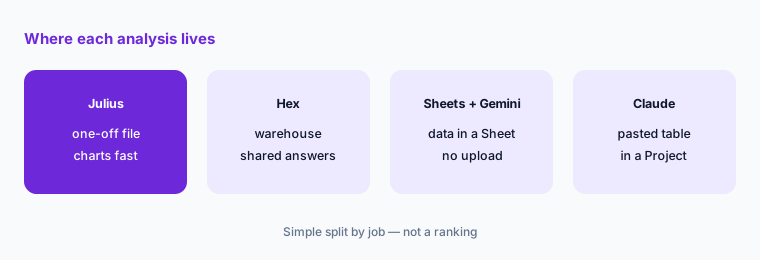
Home for the job:
Write where this week’s data lives: a file on your laptop, a Sheet, or the warehouse. File → Julius. Sheet → Gemini in Sheets. Warehouse → your BI tool or Hex.
Pricing context (October 2026)
Julius publishes prices on julius.ai/pricing. When we checked on 5 October 2026, the plan cards listed: Free $0; Plus $20/month monthly or $16/month billed yearly (2,000 credits/month); Pro $45/month or $37/month yearly (5,000 credits/month, expanded context); Max $200/month or $166/month yearly (25,000 credits/month); Business $450/month or $375/month yearly (60,000 credits/month, up to 50 team members, Postgres/BigQuery/Snowflake connectors, unlimited scheduled runs); and Enterprise on request (SSO, audit logs, roles).
Julius’s own pages don’t fully agree. The credits doc lists additional plans (Ultra $500, Growth tiers from $750) and describes the Free plan’s allowance two different ways; the pricing FAQ still mentions Custom Agents, which the docs say were sunset. Treat the live pricing page and your billing page as the source of truth.
Uncertainty: How far credits stretch depends on model, reasoning level, and task size, so we can’t say how many analyses a plan covers. Plan names and credit amounts have changed during 2026, and Julius’s pages contradict each other in places. Check the live pricing page and your Usage page before you commit to an annual plan.
When it’s useful (honest take)
Useful when you have a file, a question, and no data team — a sanitized CSV becomes charts and a cleaned table in minutes, and the Data Explorer lets you see what the chart was built from.
Less useful when the number is an official company metric: Julius doesn’t carry your certified definitions, so it can disagree with your BI tool. Less useful for sensitive data you can’t sanitize, and for anyone who needs predictable monthly cost on a heavy workload.
Paying for Julius AI and a few other AI tools? The $9 AI toolkit spreadsheet lists every AI subscription you have, what each one costs, and how fast it pays for itself, so you can see which ones are worth the money.
Want someone to do it for you? AI toolkit audit — $19
Related options (educational)
| Need | Better home | Why |
|---|---|---|
| Charts and cleaning from one CSV or spreadsheet | Julius AI (this page) | Chat plus code in a cloud container |
| Shared, endorsed answers on warehouse data | Hex AI | Notebooks, Threads, and apps |
| Data already in a Google Sheet | Sheets + Gemini | No upload, no new seat |
| A pasted table or file inside a chat plan you already pay for | Claude for data ops | Projects keep schema and notes together |
| Self-hosted BI with AI questions | Metabase Metabot | Answers tied to saved questions |
FAQ
What is Julius AI good for?
One-off analysis of a CSV or spreadsheet: ask in plain English and get tables and charts produced by code Julius runs for you. It can also connect to databases, but it isn’t a governed BI tool.
How much does Julius cost in October 2026?
On 5 October 2026 the pricing page listed Free, Plus $20/month ($16 yearly), Pro $45/month ($37 yearly), Max $200/month ($166 yearly), Business $450/month ($375 yearly), and Enterprise on request. Usage is measured in credits that don’t roll over.
Does Julius train on my data?
Julius’s privacy FAQ says your data is not used to train any models and that its AI providers are contractually bound by this. Data is stored and processed in the United States.
How long does Julius keep uploaded files?
Julius’s files doc says free-tier files are deleted after 1 hour of inactivity and paid users’ files stay up to 7 days of inactivity. Its pricing table also mentions permanent storage on paid plans, so confirm on your plan and delete files you no longer need.
Are Julius Custom Agents still available?
Julius’s docs say Custom Agents have been sunset and recommend custom instructions or reusable skill files instead, even though some pricing-page text still mentions them.
Optional next step (if seats overlap)
If a team pays for a Julius seat, a BI tool, and a general chat plan that can all chart the same CSV, that overlap is worth mapping. Map the overlap with the $19 AI toolkit audit or the $9 AI toolkit spreadsheet.
Both pages explain what you get and how delivery works before you decide.