Compare · Finance · Spreadsheet-first FP&A · Oct 2026
Datarails vs Cube (Oct 2026): Excel-friendly FP&A tools with AI assists
Datarails and Cube (the FP&A company at cubesoftware.com, not Cube.dev) both let a finance team keep its spreadsheets and add a governed data layer, reporting, and AI on top. They differ on where the team works — Datarails is built around Excel, Cube works in Excel and Google Sheets — on how consolidation and close are packaged, and on what each AI may write. This page compares them on those three points — not as a ranking — with a Try this for each.
What this comparison covers
This page is for the controller, FP&A manager, or one-person finance team at a small or mid-size company whose budgets and board packs already live in spreadsheets, and who wants AI help without moving everyone into a new modeling tool.
The short version: both connect your ERP and other systems to a governed layer and serve the numbers back into spreadsheets. Datarails calls itself Excel-native: its add-in brings live data into Excel, consolidation features are listed on every plan, and its AI Assistant (Beta) lives in the Datarails web app. Cube works in Excel and Google Sheets with the same sidebar experience, and its AI (Charlie, formerly AI Analyst) answers in the sheet as live Cube ranges. Datarails’ plans cap users; Cube’s plans list unlimited users. Neither publishes a price.
Facts come from Datarails’ and Cube’s public pricing, product, and help pages, re-checked on 7 October 2026, and match our Datarails and Cube reviews from the same day. Figures such as Datarails’ “600+” integrations are vendor claims, not our measurement.
| Question | Datarails | Cube |
|---|---|---|
| Published prices | None — Professional, Premium, Expert, each “Request Quote” | None — Bronze, Silver, Gold, each “Get quote” |
| Users per plan | 2, 5, or 15 users plus 50 viewers | Unlimited dimensions and users on every plan |
| Where the team works | Excel (add-in) plus the web app; AI Assistant lives in the web app | Excel and Google Sheets sidebar, browser app, Slack and Teams |
| Consolidation | Multi-entity, multi-currency, eliminations, multiple charts of accounts; Month-End Close module | Consolidation and close on its governed model: entities, FX, eliminations |
| How AI answers are traced | Says whether a figure came from a governed metric or an aggregation; never estimates | Answers land as live Cube ranges you can drill to transactions |
| AI writing data | Assistant never changes financial data; MCP tools read-only today (not an enforced scope) | Writes only to scenarios opened for AI write-back; flagged as AI-originated |
Major features (with how someone uses them)
Examples at a glance: each feature has a concrete example from a real job plus a short Try this you can run this week.
1. Start from one monthly report, step by step (primary)
What it is: The fairest way to compare two spreadsheet-first FP&A tools is one report you already build every month — the budget-vs-actual pack, the board deck, the department expense report. Write each step as it happens today: export from the ERP, paste into the model, map new accounts, refresh lookups, write the variance commentary, build the slides, send for review. Then, for each step, mark which tool would automate it and what still needs a reviewer. The reviewer column is where the two tools look most alike, and where your real time savings are decided.
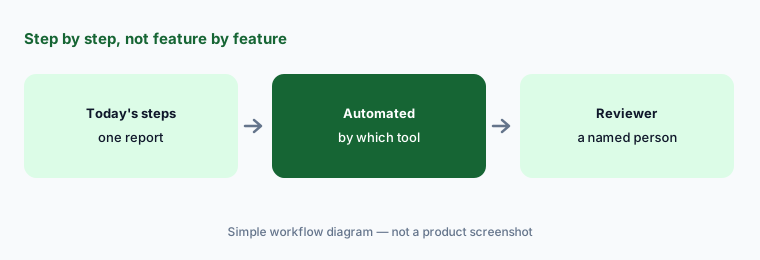
Primary workflow:
Pick one monthly report. Write each step today and mark which tool would automate it and what still needs a reviewer.
2. Where the team works: Excel vs Excel and Google Sheets
What it is: Datarails says finance teams “can stay in Excel”: its FinanceOS layer serves governed data into Excel, and AI-built reports use Datarails-connected formulas that refresh like the rest of your files. Its AI Assistant (Beta) is part of the Datarails web app; Datarails’ help center says it does not appear inside the Excel add-in or the desktop app. For AI inside Excel itself, Datarails documents Claude for Excel working with its add-in. On the pages we read, Datarails did not describe a Google Sheets add-in. Cube says its spreadsheet app works in Excel and Google Sheets: you fetch live data into your own layout, edit, and publish back, and Cube says nothing is written into your cells as hidden formulas. Charlie sits in the same sidebar, and Cube’s help center says the experience “is the same in both apps.”
If even one budget owner works in Google Sheets, that decides a lot. If everyone is in Excel, both fit, and the question becomes whether you want the AI in the sheet (Cube’s sidebar, or Claude for Excel with Datarails) or in a web app next to it (Datarails’ assistant).
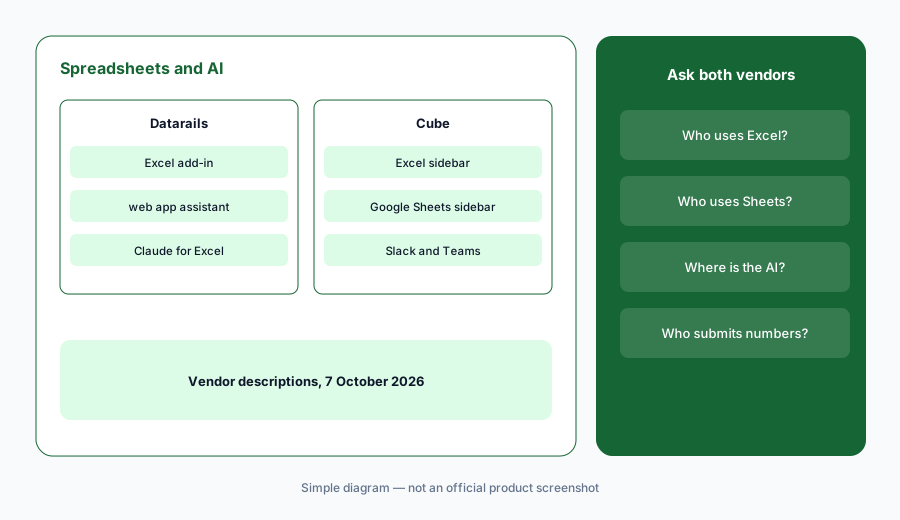
Count the spreadsheets:
List every person who submits or reviews budget numbers and whether they work in Excel or Google Sheets. Ask both vendors to show that exact mix, including where each person would see the AI.
3. Consolidation and close: what’s on the plan
What it is: Datarails says it handles multi-entity, multi-currency consolidation “out of the box,” including intercompany eliminations, currency translation, and entity-level drill-down, and its pricing comparison lists multiple charts of accounts, currency translation, intercompany eliminations, and joint-venture accounting among features included on every plan. Month-End Close — with AI flux analysis and draft journal entries that a person posts — is listed under the Expert plan and sold as an add-on; the same page says Expert includes one of Cash Management, Month-End Close, or Spend Control at no extra cost. Cube markets consolidation and close on its governed model: entities combine, currencies translate at governed rates, eliminations apply, and new GL accounts get proposed mappings that wait for your approval. Its pricing page lists three plans by features such as Slack and Teams, workflow automation, and MCP, and does not say which plan includes consolidation.
So ask the same two questions of both: which consolidation features are in the plan you are quoted, and whether close tasks (reconciliations, flux, journals) are in scope or stay in your close tool such as FloQast or Numeric.
One email, both vendors:
Write your entities, currencies, intercompany charges, and charts of accounts in one email. Ask both vendors which plan covers that consolidation and whether close tasks are included, extra, or out of scope.
4. AI answer traceability
What it is: Datarails’ AI Assistant reads your data under your permissions. Its help center says that for named figures such as revenue or margin it tells you whether the number came from a governed business metric or from an aggregation of the underlying table, that it “never estimates or fabricates a number,” and that if it cannot answer it says so and asks one clarifying question. Cube’s Charlie answers plain-English questions in the sheet; results can be added as live Cube ranges you can drill, filter, and fetch like any range you built yourself. Smart Analysis returns the top five variances by amount and percentage with AI notes on drivers. Both vendors say their AI follows each user’s data access.
Traceability claims are worth testing, not trusting. Ask the same variance question in both and follow each answer to its source: in Datarails, which metric or table it used; in Cube, the transactions behind the range it returned. Delete any sentence you cannot trace.
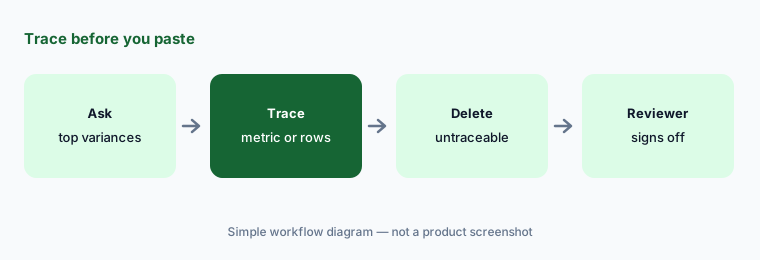
Trace before you paste:
Ask both tools for last quarter’s three largest expense variances. Follow each answer to the metric, table, or transactions it came from, and delete any claim you cannot trace before it goes in a report.
5. What each AI may change, and how it is metered
What it is: Datarails’ help center says its assistant “never changes your financial data” and states exactly what it will create before making a chart, file, or widget. Its FinanceOS AI Connector (MCP) lets Claude, ChatGPT, or Copilot query your Datarails data; every tool listed today is read-only, but Datarails says that is “a property of the tools currently published, not an enforced permission scope,” write tools are on its roadmap, and per-query audit events from the MCP layer are not yet complete. Cube’s AI writes, but only into scenarios opened for AI write-back or created by the AI; its Planner Agent never modifies your Budget, Forecast, or Actuals, and tags each assumption User or AI. Through Cube’s MCP server, writes are attributed to you and flagged as AI-originated; Use MCP (Write) is on by default for Admin and Finance users, and one table-write tool replaces the full dataset for that table and scenario — rows the AI does not resend are removed. Cube meters all AI in contracted AI credits; Datarails calls its AI Connector a paid feature and switches agents on per account.
Write the rule before turning anything on: who may let an AI write, into which scenarios, and who reviews the change. For Datarails, control access with Datarails permissions rather than relying on today’s read-only tool list. For Cube, review the Use MCP (Write) default for your Finance group.
Write the rule first:
Write who may let an AI write data, into which scenarios, and who reviews it. Check it against Cube’s Use MCP (Write) default and Datarails’ permissions before connecting Claude or ChatGPT to either.
6. Where each fits, and when neither is the answer
What it is: Datarails fits small and mid-size teams that work in Excel, want consolidation features on every plan, and may add close, cash, or spend modules later. Cube fits teams that want Excel and Google Sheets as the front end with AI in the sidebar, unlimited users on every plan, and AI that drafts scenarios without touching official numbers. If you are ready to move planning into a dedicated model, see Pigment vs Anaplan, Abacum, or Planful; if you live in Microsoft 365, Vena is another Excel-native option. A team with one well-built Sheet may get enough from Gemini in Sheets for now.
Running both is rare. If you already pay for one of them plus a general chat assistant that finance uses on exported data, compare that pair on your one-report list before adding another seat.
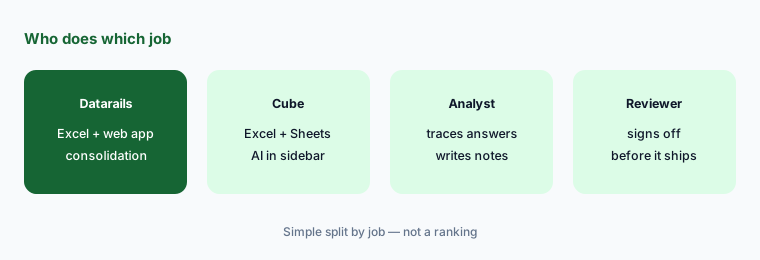
Compare the pair you have:
If finance pays for one of these tools plus a chat assistant used on exports, run your one-report step list against that pair and against the other tool. Count steps automated and name the reviewer for each.
Pricing context (October 2026)
Datarails does not publish prices (as of 7 October 2026). Its pricing page shows Professional (2 users, 1 integration, Datarails AI Agents, FinanceOS AI Connector), Premium (adds Spend, 5 users, 2 integrations), and Expert (adds Cash Management, Month-End Close, Receivables, and Desk; 15 users plus 50 viewers; 3 integrations), each with “Request Quote.” Its help center calls the AI Connector a paid feature and says agents are switched on per account.
Cube does not publish prices either (as of 7 October 2026). Its pricing page says “Get Custom Quote” and lists Bronze, Silver (adds Slack/Teams, workflow automation, PowerPoint/Slides, and MCP integration), and Gold (adds premium support and all integrations and workflows), each with unlimited dimensions and users. The same page lists MCP Integration under Silver and Gold but also says the agent teams and Cube MCP Server come with “Every tier” — confirm in writing. AI use draws on contracted AI credits; no credit price is public.
Uncertainty: Neither vendor showed prices on 7 October 2026, so we quote none; any figure elsewhere is someone’s quote, not a list price. Datarails’ AI Assistant is labeled Beta and its MCP tool list may add write tools; Cube’s MCP availability by tier is inconsistent on its own pricing page. Google Sheets support for Datarails was not described on the pages we read — ask.
When it’s useful (honest take)
Datarails is useful when the team lives in Excel, needs multi-entity consolidation without a separate tool, wants an AI assistant that says where each figure came from and never changes data, and has few enough finance users to fit the plan’s user count.
Cube is useful when budget owners use Excel and Google Sheets, you want AI answers in the sidebar as live ranges, you want many users without per-user limits on the plan, and you will set clear rules for AI write-back into scenarios.
Less useful when (either one) nobody owns account mappings and definitions — both AIs answer from the governed layer as built — or the team is ready to leave spreadsheets for a dedicated planning model (see Pigment vs Anaplan).
Still choosing between Datarails and Cube? The $19 AI toolkit audit gives you a written plan for which tools to keep using and which to drop across your whole AI stack, including this pair.
Prefer to do it yourself? Spreadsheet — $9
Related options (educational)
| Need | Better home | Why |
|---|---|---|
| Excel-native FP&A with consolidation | Datarails | AI Assistant (Beta), Month-End Close, AI Connector |
| Excel and Google Sheets with AI in the sidebar | Cube | Charlie, Smart Analysis, Planner Agent |
| Excel-native planning in Microsoft 365 | Vena AI | Copilot agents on an Excel front end |
| Move planning into a dedicated model | Pigment vs Anaplan | Agents inside the planning model |
| One well-built Google Sheet | Gemini in Sheets | Light AI help without a platform |
| Month-end close and reconciliations | FloQast or Numeric | Different job: close, not planning |
FAQ
Is Datarails or Cube better for Excel users?
Neither in general, and this page is not a ranking. Both serve governed data into spreadsheets. Datarails is built around Excel with consolidation on every plan; Cube works in Excel and Google Sheets with AI in the sidebar. Map one monthly report step by step and see which steps each would automate.
Does Datarails work in Google Sheets?
Datarails describes its product as Excel-native, and the pricing, product, and help pages we read on 7 October 2026 did not describe a Google Sheets add-in. Its AI terms mention Google Workspace data handling. If anyone on your team uses Google Sheets, ask Datarails in writing how they would work.
How are Datarails and Cube priced?
Neither published prices on 7 October 2026. Datarails lists Professional, Premium, and Expert plans with 2, 5, or 15 users; Cube lists Bronze, Silver, and Gold with unlimited users. Both ask you to request a quote, and Cube meters AI in contracted credits.
Can either AI change our official numbers?
Datarails says its assistant never changes financial data, and its MCP tools are read-only today, though that is not an enforced scope. Cube’s AI writes only to scenarios opened for AI write-back or created by the AI, and its Planner never modifies Budget, Forecast, or Actuals. A person reviews before anything is merged or posted.
Is this Cube the same as Cube.dev?
No. This page covers Cube the FP&A platform at cubesoftware.com. Cube.dev is an unrelated semantic-layer company.
Optional next step (if seats overlap)
If finance pays for an FP&A tool’s AI, a chat assistant used on exports, and a spreadsheet copilot that all write the same variance commentary, that overlap is worth mapping before renewal. Map the overlap with the $19 AI toolkit audit or the $9 AI toolkit spreadsheet. Email Audit $19 or Toolkit spreadsheet $9.
Checkout is live via Stripe. After you pay, we email delivery (spreadsheet) or intake next steps (audit).