Status and migration · Spreadsheets · Rows · Oct 2026
Rows AI in Oct 2026: what happened after Superhuman bought Rows, and where to move
Rows was a spreadsheet with built-in data connectors and an AI Analyst that could pivot, join, and chart a table from a plain-English request. Status first: Superhuman agreed to acquire Rows in February 2026, and Rows said it would sunset the product, with rows.com fully winding down on 31 May 2026. When we checked on 5 October 2026, rows.com’s marketing and help pages were still up, but sign-up and login pages returned “not found” and every “Get started” button led to Superhuman Docs. This page explains what Rows did well, how to get your work out, and where to run the same workflow now — with formulas a person can still read.
What this Rows AI page covers
This page is for the founder, marketer, or ops lead at a small team who liked the idea of Rows: pull Google Analytics, Stripe, HubSpot, or ad-platform data straight into a spreadsheet, then ask an AI analyst to summarize it. The question it answers in October 2026: what did Rows actually do, can you still use it, and how do you keep the useful part — connected data plus AI help, with formulas you can check — after Rows itself has wound down?
Rows had three AI pieces. The AI Analyst was a chat panel that could analyze tables, add columns, join tables, build charts, clean data, and generate whole spreadsheets. Rows AI functions such as CLASSIFY_AI, EXTRACT_AI, and SUMMARIZE_AI ran prompts cell by cell. And Data Tables pulled live data from 50+ integrations on a schedule. A native pivot table sat underneath, separate from the AI.
Facts come from Rows’ own help docs, pricing page, changelog (last entry 16 February 2026), and the February 2026 announcements from Rows and Superhuman, plus Superhuman’s help center, as we read them on 5 October 2026. We could not log in to a Rows workspace to confirm what, if anything, still runs; where we say “can’t,” it’s based on the public checks above.
Major features (with how someone uses them)
Examples at a glance: each feature has a concrete example from a real job plus a short Try this you can run this week.
1. Move one table out and check the totals (primary)
What it is: Rows’ most useful setup was a Data Table fed by a connector (Google Analytics 4, Stripe, HubSpot, Facebook Ads, Snowflake, BigQuery and many more) through Data Actions, refreshed daily on Plus or every minute on Pro, with the AI Analyst or the native Insert > Pivot Table editor summarizing it. Rows documented Download as CSV from a table’s options menu, which saves one table as plain values. That CSV is the cleanest thing to carry out: Superhuman Docs imports CSVs with /import (up to 10,000 rows per file, per its help center), and Google Sheets opens them with File > Import.
The habit worth keeping: a moved table is done only when its totals match. Pick the numbers people actually quote from it — row count, total revenue, total sessions — and check them against the export before you rebuild any pivot or chart on top. Connector refreshes don’t travel with a CSV, so reconnect the source in the new tool after the totals match. If you can’t open your Rows workspace and never exported, Rows’ site lists support@rows.com for inquiries.
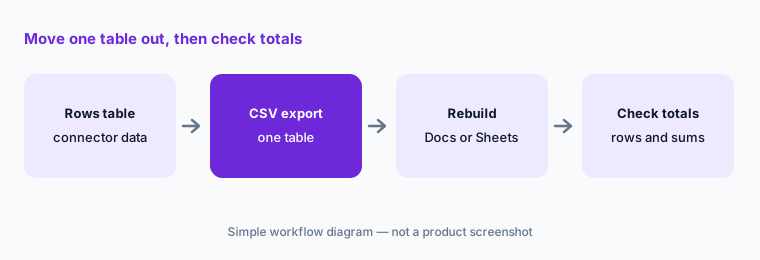
Primary workflow (migration — with a CSV you already exported, or one you can still download):
Export one Rows table to CSV. Rebuild it in Superhuman Docs or Google Sheets. Check that the row count and each column total match the CSV before anyone uses the new version.
2. What the AI Analyst actually saw
What it is: Rows was unusually clear about this. Its FAQ said the AI Analyst sends the model a summary of your dataset: the table headers, a sample of up to 5 rows, and basic statistics such as min and max. Rows’ guide says the Analyst “derives its knowledge about the dataset from a sample of rows and the header.” Rows said it used a mix of models (it named OpenAI’s GPT-4o models and Llama), didn’t let customers pick a model, and didn’t use customer data to train models for others.
That design explains both its strengths and its misses. It could infer that Revenue minus Cost is profit from the headers alone, but it couldn’t know about an odd category that never appeared in the five sample rows. Rows also kept checkpoints — a new one after every three prompts or when the Analyst ran more than three actions in a row, up to 50 per spreadsheet for seven days — so you could roll back an AI edit.
COUNTIFS column and found 14.
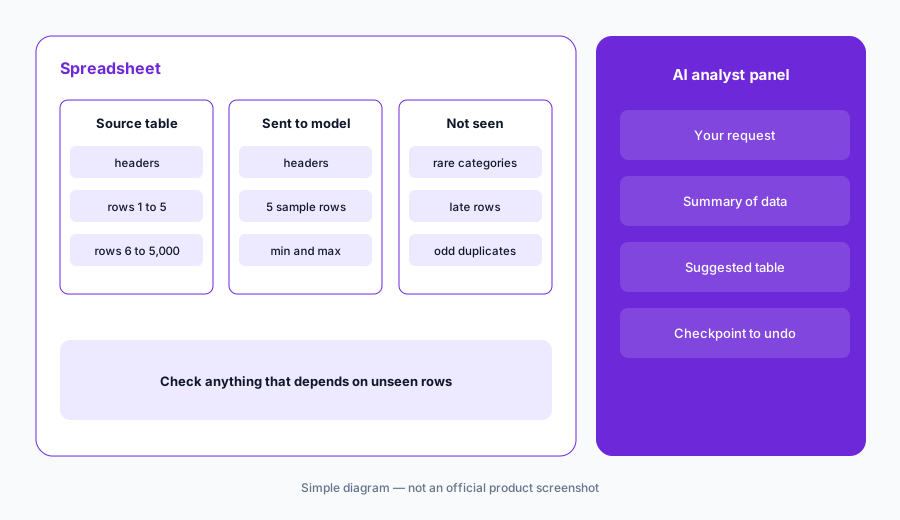
Test what it can’t see:
In any AI spreadsheet assistant, ask for a count you can check by hand — one where the answer depends on rows near the bottom of the table. If the AI misses it, write that rule as a formula column instead.
3. AI functions: prompts you can see in the cell
What it is: Rows AI functions put the prompt in the formula bar: CLASSIFY_AI(A2, "Engineering, billing, sales", false) to tag a support ticket, EXTRACT_AI("Zip code", A2) to pull a zip code from an address, SUMMARIZE_AI(A2, "two bullet points") for a review, plus SENTIMENT_ANALYSIS_AI, TRANSLATE_AI, REWRITE_AI, and others. Rows’ docs suggested leaving temperature at its default of 0 for well-defined answers, and its pricing page counted cell enrichments against a monthly task allowance.
The idea outlives Rows: an AI column whose prompt and categories are visible in every cell is easier to review than an answer in a chat thread. Google Sheets, Airtable, and Superhuman Docs all offer some form of AI column today — check each one’s docs for its current function names and limits.
CLASSIFY_AI column and three fixed categories. Because the categories were written in the formula, a teammate could see why “refund didn’t arrive” landed in Billing. They spot-checked 20 rows, found two mislabeled password-reset tickets, and added a fourth category instead of rewriting the prompt.
Make the prompt visible:
Pick one text column you tag by hand today. In your spreadsheet tool’s AI column or function, list the exact categories in the prompt. Run it on 20 rows and check every one before filling the column.
4. What XLSX and CSV exports keep and drop
What it is: Rows documented two exports. Download as XLSX (from the ••• More options menu) saves the whole spreadsheet as one file. Download as CSV (from a table’s options menu) saves one table. Rows listed what XLSX export drops: text blocks, charts created with Python, conditional formatting, merged cells, and advanced pivot table features not supported in Excel, which become a standard table.
That last point is why the primary workflow rebuilds pivots instead of trusting them: an AI-built or advanced pivot may arrive in Excel as plain values. Connector Data Tables also stop refreshing once they leave Rows — they become a snapshot. If you still have exported files, treat them as historical data and rebuild live connections in your new tool.
SUMIFS, labeled the Stripe tab “snapshot, May 2026,” and reconnected Stripe in her new spreadsheet.
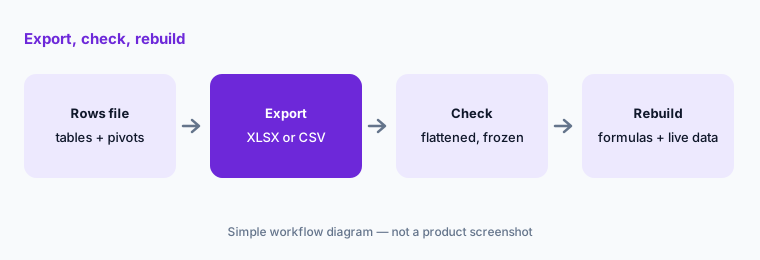
Check your export:
Open one exported Rows file. List every pivot, chart, and connector table in it, and mark each as still working, flattened to values, or frozen. Rebuild the flattened ones as formulas first.
5. Moving to Superhuman Docs (formerly Coda)
What it is: Superhuman said the Rows team would strengthen Coda, which Superhuman renamed Superhuman Docs on 8 July 2026 (Superhuman’s help center says coda.io links redirect to docs.superhuman.com and existing docs, Packs, and formulas keep working). Today rows.com’s buttons point there. Superhuman Docs can import CSVs into new or existing tables with /import — its help center says up to 10,000 rows per CSV, so split larger files — and syncs outside data through Pack tables.
Superhuman Docs is a doc-and-table workspace rather than a grid spreadsheet, so a Rows model full of cell references won’t map one-to-one. It suits trackers, dashboards, and tables more than dense financial models. For the full picture, see our Coda AI page, and check Superhuman’s current pricing on its site before you move a team.
Sort before you move:
List your Rows spreadsheets. Mark each as table-and-tracker or formula model. Move the first group to a doc-and-table tool, the second to a grid spreadsheet, and move only one of each this week.
6. Where the connected-spreadsheet job lives now
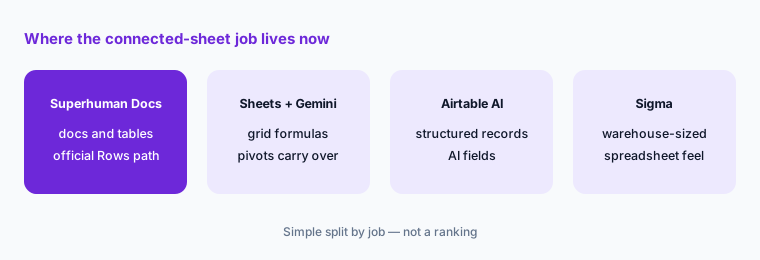
What it is: The job Rows did — live business data in a grid, plus AI that summarizes and pivots it — is now spread across tools you may already pay for. Google Sheets with Gemini and Excel with Microsoft 365 Copilot bring AI into a familiar grid; Airtable AI suits structured records with AI fields; Superhuman Docs is the official landing spot for Rows customers; and when the data is warehouse-sized, a BI tool such as Sigma keeps a spreadsheet feel on top of the warehouse.
Whichever you pick, keep the rule from the primary workflow: check the totals after the move, let AI draft the summary, and make sure the number someone shares comes from a pivot or formula a person can open.
Pick the new home:
Write down the three connectors you used most in Rows. For each candidate tool, check whether it connects to all three today. Pick the one that covers the most without a new seat.
Pricing context (October 2026)
Rows no longer sells plans, and there’s nothing to buy or sign up for. For reference only, Rows’ last price list — still displayed on rows.com/pricing when we checked on 5 October 2026, with every button pointing to Superhuman Docs — was: Free $0 with 5 AI tasks a month; Plus $8 per user per month billed monthly ($6 billed annually) with 200 AI tasks a month; Pro $79 per month plus $8 per user billed monthly ($59 plus $6 billed annually) with 1,000 AI tasks a month; and Enterprise by contact. Rows counted each AI Analyst message as one AI task. These are historical prices, not current offers.
Rows announced it would fully wind down on 31 May 2026, and rows.com’s sign-up and login pages now return “not found.” If you’re moving, the cost that matters is the tool you move to — check Superhuman Docs, Google Workspace, Microsoft 365, or Airtable pricing on their own sites.
Uncertainty: We couldn’t log in to a Rows workspace, so we can’t confirm whether existing workspaces, exports, or the Rows API still work for anyone; our checks were public pages only (sign-up and login 404, app and API hostnames not resolving). Rows’ own AI Analyst FAQ also says Plus “offers unlimited usage,” which conflicts with the 200 AI tasks a month on its old pricing table — the pricing table was the later billing reference. Contact support@rows.com about any account-specific question.
When it’s useful (honest take)
Useful when you’re a former Rows customer deciding where your spreadsheets go, or you’re evaluating any connected spreadsheet and want a checklist from one that did it well: connector tables on a schedule, an AI analyst that names what it saw, AI functions with prompts visible in the cell, and a native pivot to check the AI against.
Less useful when you want to start using Rows today — as far as we can tell from public pages, you can’t. Also less useful for warehouse-sized data (Rows was never a warehouse) and for teams that need every number to come from formulas a person wrote; in that case, use the AI only for drafts and commentary.
Paying for Rows AI and a few other AI tools? The $9 AI toolkit spreadsheet lists every AI subscription you have, what each one costs, and how fast it pays for itself, so you can see which ones are worth the money.
Want someone to do it for you? AI toolkit audit — $19
Related options (educational)
| Need | Better home | Why |
|---|---|---|
| Rows customers following the official path | Superhuman Docs (formerly Coda) | Where Rows’ team went; CSV import up to 10,000 rows per file |
| Formula models in a familiar grid | Google Sheets + Gemini | Pivots and cell references carry over from XLSX |
| Excel-first teams on Microsoft 365 | Microsoft 365 Copilot | Copilot in Excel on files you already have |
| Structured records with AI fields | Airtable AI | Records, views, and AI fields per row |
| Warehouse-sized data with a spreadsheet feel | Sigma AI | Formulas run as live warehouse queries |
| Dashboards from marketing connectors | Looker Studio + Gemini | Free connectors for Google marketing data |
FAQ
Is Rows still available in October 2026?
As far as we can tell, not for new users. Rows announced in February 2026 that it had agreed to be acquired by Superhuman and would fully wind down rows.com on 31 May 2026. On 5 October 2026 its sign-up and login pages returned “not found” and its buttons pointed to Superhuman Docs.
What did the Rows AI Analyst send to the AI model?
Rows’ FAQ said it sent a summary of your dataset: table headers, a sample of up to 5 rows, and basic statistics such as min and max values. That’s why it could misread patterns that didn’t appear in the sample.
How much did Rows cost?
Rows no longer sells plans. Its last price list, still displayed on rows.com on 5 October 2026, was Free ($0, 5 AI tasks a month), Plus ($8 per user per month, or $6 billed annually, 200 AI tasks), and Pro ($79 a month plus $8 per user, or $59 plus $6 annually, 1,000 AI tasks). Treat these as historical, not as prices you can buy today.
What happens to Rows pivot tables when I export to Excel?
Rows’ export docs say advanced pivot table features not supported in Excel are converted to a standard table, and text blocks, Python charts, conditional formatting, and merged cells aren’t kept. Rebuild key pivots as formulas after export.
Where should former Rows users go?
Superhuman points Rows users to Superhuman Docs (formerly Coda), which imports CSVs up to 10,000 rows each. Formula-heavy models often fit better in Google Sheets or Excel, and structured records in Airtable. Pick by the connectors you need.
Optional next step (if seats overlap)
If your team is replacing Rows and already pays for Google Workspace or Microsoft 365, plus an AI chat, plus a BI tool, check which of those can take the job before adding a new seat. Map the overlap with the $19 AI toolkit audit or the $9 AI toolkit spreadsheet. Email Audit $19 or Toolkit spreadsheet $9.
Checkout is live via Stripe. After you pay, we email delivery (spreadsheet) or intake next steps (audit).