Feature · Claude · Ops dashboards
Claude Artifacts for ops dashboards (Oct 2026): lightweight charts beside chat
Extends the Artifacts how-to for weekly ops: small charts and movers tables beside chat, a Slack-ready caption, and an honest line on when you still need real BI.
Who this page helps
Ops leads who already use Claude and want a lightweight weekly dashboard — one trend chart, a movers table, three bullets — without standing up Looker or rebuilding Sheets. If you need governed metrics, row-level security, or a shared definition of “revenue,” this is the wrong tool; keep your BI or Sheets system of record.
What an Artifact dashboard is
When Claude opens a substantial chart, table, or small interactive view in the Artifact pane beside chat, you can iterate on the visual without losing the thread. This page focuses on that pane as a weekly ops dashboard: attach a KPI CSV, ask for chart + movers + caption, spot-check, paste to Slack. It extends the general Artifacts how-to and pairs with Claude and Claude for ops.
Major patterns (with how someone uses them)
Examples at a glance: each pattern has a concrete ops example plus a Try this mini-workflow.
1. Weekly KPI CSV → chart + table
What it is: Attach a clean weekly KPI export (tickets closed, SLA %, refunds, cycle time). Ask Claude to open an Artifact with one trend chart, one table of top movers, and short notes — not a 12-chart executive pack. Best when column names are stable and units are obvious in the file.
weekly_ops_kpis.csv, asks for a tickets-closed trend, top three movers with deltas, and refuses any invented metrics not in the file.
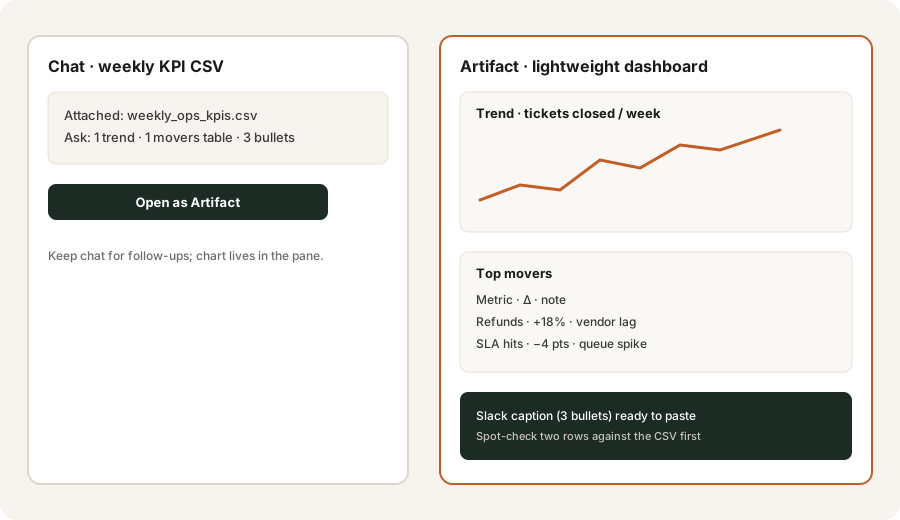
Attach a weekly KPI CSV you already trust:
Attach a weekly KPI CSV. Artifact: simple dashboard — 1 trend chart, 1 table of top movers, 3 bullets. Caption I can paste into Slack.
2. Slack caption beside chat
What it is: Ask for a three-bullet caption grounded only in the Artifact numbers so you can paste into Slack without rewriting. Keep ownership language honest — if the CSV has no owner column, say so.
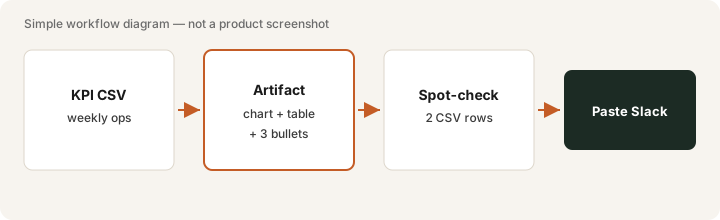
After the Artifact renders:
From only the Artifact chart and movers table, write 3 Slack bullets: trend, top mover, one risk. Do not invent metrics or owners not in the CSV.
3. Iterate in the pane
What it is: Use follow-up chat to tweak axes, swap the trend metric, or reorder movers — without rebuilding a BI dashboard. Spot-check two rows against the CSV every time before you paste externally.
On a messy first render:
Rebuild the Artifact using only week_ending for the x-axis. Keep 1 chart and 1 movers table. List the two CSV rows I should spot-check.
4. Not a BI replacement
What it is: An honest boundary. Artifacts accelerate this week’s visual. They do not replace shared metric definitions, permissions, scheduled refreshes, or audit trails. When finance or leadership needs a single source of truth, stay in Sheets/Looker/your warehouse — and optionally use Claude only for a draft caption from an official export.
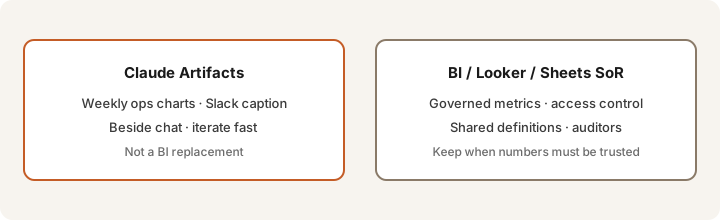
Before replacing a BI view:
List who owns the metric definition, who needs access control, and whether this chart must refresh weekly without a human. If any answer is unclear, keep BI and use Artifacts only for a draft caption.
Public pricing context (October 2026)
Artifact dashboards ride on your existing Claude plan — there is no separate “dashboard SKU.” From public claude.com/pricing (Oct 2026):
- Free: Artifacts available with usage limits.
- Pro: about $20/month billed monthly (~$17/mo annual). Higher usage for heavier CSV + chart loops.
- Max: from about $100/month for heavy daily use.
- Team: from about $25/member/month monthly for shared seats — confirm live.
Uncertainty flags: Plan bundles, Artifact rate limits, and Team seat list prices change. Never budget from a blog table alone — open claude.com/pricing. Full product pricing lives on the Claude review.
When Artifact dashboards are useful (honest take)
They tend to help when you already pay for Claude, the KPI CSV is clean, and you need a Friday Slack visual faster than building a lasting dashboard. They tend not to help when definitions are disputed, access must be controlled, charts must refresh unattended, or leadership expects a governed BI link. Parallel seats (Claude + ChatGPT + BI) without a named owner for each job is the sprawl this site warns about.
Paying for Claude Artifacts and a few other AI tools? The $9 AI toolkit spreadsheet lists every AI subscription you have, what each one costs, and how fast it pays for itself, so you can see which ones are worth the money.
Want someone to do it for you? AI toolkit audit — $19
Alternatives compared: Artifact vs BI vs Sheets paste
| Axis | Claude Artifacts | Sheets / Looker BI | Chat paste only |
|---|---|---|---|
| Best when… | Weekly lightweight chart beside chat. | Shared definitions and access control. | One-off bullets, no visual needed. |
| Cost shape (Sep 2026) | Existing Claude seat (see claude.com/pricing). | Sheets/Workspace or BI seats. | Near-$0 time in any chat seat. |
| Less useful when… | You need governed, refreshed dashboards. | You only need a one-off Slack chart. | Stakeholders need a chart, not prose. |
Also see Claude Artifacts how-to, Claude, Claude for ops, Claude Projects, Google Sheets + Gemini, and the ops & automation hub.
FAQ
What is a Claude Artifact dashboard for ops?
A lightweight chart, movers table, and caption in the Artifact pane beside chat — useful for weekly KPI CSVs, not a governed BI workspace.
Is Claude Artifacts a BI replacement?
No. Keep BI/Sheets SoR when metrics need shared definitions, access control, and audit trails. Use Artifacts for fast weekly visuals you will paste.
How does this relate to the Claude Artifacts how-to?
This page extends the how-to for the dashboard job. Start with Artifacts how-to for the pane workflow.
Do I need a paid Claude plan?
Artifacts work on Free with limits; Pro/Team increase usage. Confirm on claude.com/pricing.
Optional next step (if seats overlap)
If Claude Artifacts are one of several AI seats and you want a written pass across the whole list, the optional $19 AI toolkit audit produces a short memo. Prefer an editable grid? The $9 AI toolkit spreadsheet is a one-time CSV. Soft offer only — this deep-dive stands alone.
Checkout is live via Stripe. After you pay, we email delivery (spreadsheet) or intake next steps (audit). Or email hello@ with subject Audit $19 / Toolkit spreadsheet $9.