Tool · Ops & automation · Grafana · Oct 2026
Grafana Assistant review (Oct 2026): query and dashboard assists for ops
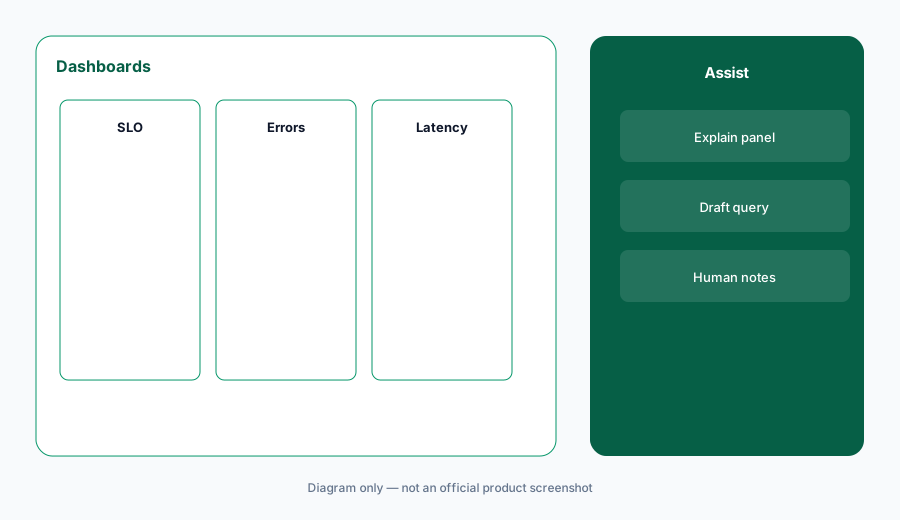
Grafana Assistant when the boards people trust are already Grafana. Explain a panel. Draft a query. A human decides whether the panel is worth an alert. New Relic AI if that is the other telemetry home. Datadog Bits if Datadog is the record.
What this page covers
This page is for ops leads who already run dashboards in Grafana and want help reading a panel or drafting a query. We did not fetch a Grafana price or a changelog for this review, so we do not claim what shipped in September or what a seat costs. Confirm the assistant’s name in your Grafana org. Self-hosted and cloud Grafana are not the same admin screen. The jobs below assume the data is already in a data source you are allowed to query.
Major features (with how someone uses them)
Examples at a glance: each feature has a concrete ops example plus a short Try this.
1. Explain a panel you can point at (primary)
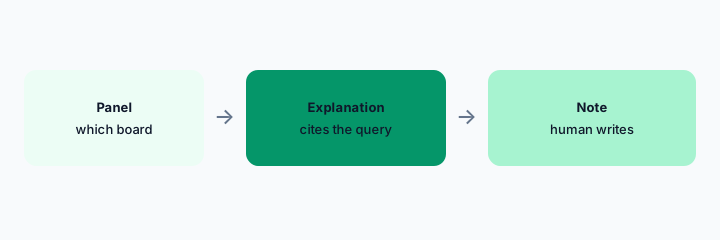
What it is: Name the dashboard and the panel. Ask what the query is doing in plain language, and which filters are on. If the explanation mentions a label that is not on the panel, drop it. Do not turn the explanation into an incident update until a human compares it to the graph.
Primary workflow:
Pick one red panel. Ask for the query in words and the filters. Delete any sentence you cannot match to the panel.
2. Draft a query against a source you have
What it is: Say the data source (Prometheus, a SQL store, a log store) only if you already use it in Grafana. Ask for a draft. Run it in Explore yourself. A draft that names a metric your org does not emit is noise.
Query check:
Write the data source you will use. Draft one query. Run it. If it returns nothing, mark the metric name Unknown.
3. Do not let a panel explanation become a page
What it is: An explanation can suggest a condition. Enabling an alert, a contact point, or a page is a human change. PagerDuty AI remains the paging home if that is where pages fire. Grafana should not gain a second, quieter paging path that nobody reviews.
Alert check:
Draft one alert idea from a panel. Write the reason you would not enable it yet.
4. Versus New Relic, Honeycomb, and Datadog
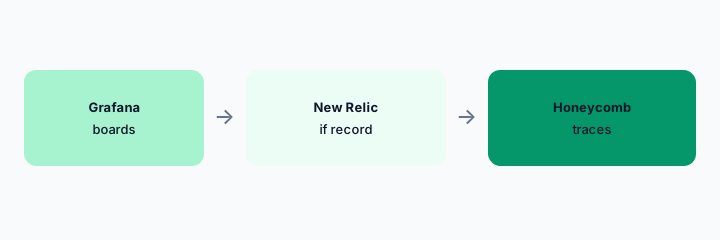
What it is: Stay in Grafana when the trusted picture is a Grafana panel. Use New Relic AI or Datadog Bits when that product is the record. Use Honeycomb AI when the question is a high-cardinality trace you already send to Honeycomb. Asking all four the same question is how seats pile up.
Home for the job:
Name the one board your on-call opens first. That product is the home for assistant questions this month.
Pricing context (October 2026)
We did not open this vendor’s public price table for this review. October 2026 is the date of the page, not a quote. Use the vendor’s live pricing page and your invoice.
If an assist is included or missing on your plan, record that from the admin screen.
Uncertainty: Names, limits, and which workspaces have the assist change. This page does not claim a dollar price or a general-availability date.
When it’s useful (honest take)
Useful when Grafana is already the board and a human checks the explanation against the panel. Less useful if you wanted it to discover data sources you have not connected. Less useful as a fourth assistant beside New Relic, Datadog, and Honeycomb.
Paying for Grafana Assistant and a few other AI tools? The $9 AI toolkit spreadsheet lists every AI subscription you have, what each one costs, and how fast it pays for itself, so you can see which ones are worth the money.
Want someone to do it for you? AI toolkit audit — $19
Related options (educational)
| Need | Better home | Why |
|---|---|---|
| Boards already in Grafana | Grafana Assistant (this page) | Explain the panel; a human checks |
| New Relic holds the data | New Relic AI | Do not split the question |
| High-cardinality traces | Honeycomb AI | If Honeycomb is the trace store |
| Datadog is the record | Datadog Bits | Stay with the graphs you have |
FAQ
What is Grafana Assistant on this page?
A job name for query and panel explanations inside Grafana. Confirm the live product name in your org. We did not verify a price.
How much does it cost?
We do not say. Check Grafana’s pricing and your invoice.
Can it change alerts?
It can suggest. A human enables contact points and pages.
Self-hosted or cloud?
The admin screen differs. Confirm which one you run before you follow a cloud-only instruction.
Optional next step (if seats overlap)
If two AI seats would answer the same question, map the overlap with the $19 AI toolkit audit or the $9 AI toolkit spreadsheet. Email Audit $19 or Toolkit spreadsheet $9.
Checkout is live via Stripe. After you pay, we email delivery (spreadsheet) or intake next steps (audit).