How-to · Observability · Grafana Assistant · Oct 19, 2026
Ask Grafana Assistant to explain an inherited dashboard, and have its owner check the explanation before on-call relies on it
Grafana Assistant can explain panels and draft queries when Grafana already holds your boards. An explanation that misnames a metric still misleads on-call if it becomes the runbook. This page shows how to explain one inherited board with an owner check. Datadog Bits investigation questions are a different job in Datadog.
Who this is for
Ops teams whose source-of-truth boards already live in Grafana. The job here is owner-checked panel explanations before on-call relies on them.
How to do it
This is a how-to, not a ranking of observability assistants. Per the Grafana Assistant review, the assistant helps with query and dashboard explanations when Grafana holds the boards; we did not invent prices. The ground rule: no explanation enters the runbook until the dashboard owner checks it against the panels.

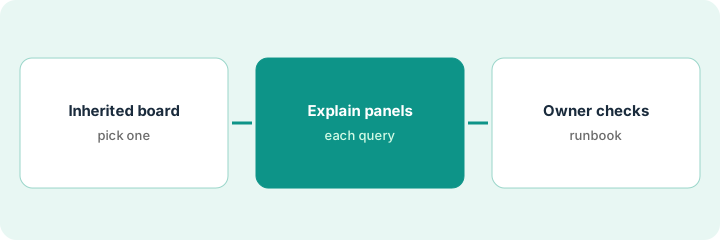
1. Pick one inherited board
What it is: Choose one dashboard on-call already opens, preferably one the current team did not build.
- Name the dashboard and its owner.
- Confirm you may query its data sources.
- Skip creating new alerts from explanations in this routine.
- Keep New Relic or Datadog questions in those tools if that is where the truth lives.
- Write why this board matters to on-call.
On-call inherits a checkout SLO dashboard from a departed engineer. The current owner is named in the team wiki.
Write the dashboard URL and owner before you ask the assistant anything.
2. Ask Assistant to explain each panel query
What it is: For each critical panel, ask what the query does and which filters apply, and paste answers into a draft note.
- Ask one panel at a time.
- Demand metric names and filters in the answer.
- Delete any sentence you cannot match to the panel.
- Do not draft paging rules from the explanation yet.
- Save draft notes outside Grafana.
The assistant says the panel is a five-minute error ratio on a named metric. The engineer keeps the panel JSON open beside the note.
Explain each critical panel and delete unmatched sentences.
3. Owner checks, corrects, and pastes into the runbook
What it is: The dashboard owner corrects the notes against the real queries, then pastes only checked notes into the on-call runbook.
- Owner reads every panel note.
- Correct metric names and filters.
- Paste checked notes into the runbook with a date.
- Refuse to add contact points from unchecked explanations.
- Revisit when the board changes.
The owner finds a filter the assistant omitted. Notes are fixed; on-call gets the corrected runbook section only.
Owner signs the notes before they enter the runbook.
Pricing context (October 2026)
This how-to isn’t a price sheet. Per the Grafana Assistant review, we do not invent Grafana prices here; confirm Cloud or self-managed pricing on grafana.com/pricing for your stack. Dated October 2026.
Checked Oct 19, 2026 on the vendor’s own pricing page: Grafana’s pricing page lists Cloud plans including a free tier and paid tiers; this thin how-to quotes no Grafana dollar figure. This page quotes no Grafana dollar figure; confirm what your contract includes with Grafana or your admin.
Uncertainty: The only prices this site sells here are the optional $9 AI toolkit spreadsheet and $19 AI toolkit audit.
When this helps (honest take)
Useful when Grafana already holds the boards on-call trusts and an owner will check explanations.
Not useful when the trusted picture lives in Datadog or New Relic instead, or nobody owns the board.
Related options (educational)
| Need | Where to look | Why |
|---|---|---|
| Grafana Assistant | Grafana Assistant | Primary path |
| Datadog Bits questions | Datadog Bits investigation questions | A different job (Datadog) |
FAQ
Should explanations create alerts?
No. Per our review, enabling alerts or contact points is a human change. Check explanations first.
How much does Grafana Assistant cost?
This page quotes no Grafana dollar figure. Confirm on Grafana’s pricing page for your deployment.
Optional next step
If you want a one-page toolkit map for the tools you already pay for, use the optional $9 AI toolkit spreadsheet. If you want a short review of seat waste and unused tools, use the optional $19 AI toolkit audit. Neither is required to follow this how-to.